10/10/2001 -- Many Excel users have heard of pivot tables, but don't understand how to create or use them. But if you're working on your MOUS, there's a pivot table in your future: activities using pivot tables are included in the MOUS Excel Expert exam. In this column, we'll show you how to use pivot tables, one of Excel's least used but most powerful features.
Starting Out
The first requirement for creating a pivot table or pivot chart is an Excel database. We'll use a course database that includes these fields: Category, Course Name, Hours, Start Date, number of Trainees, and the course Fee (see image below).
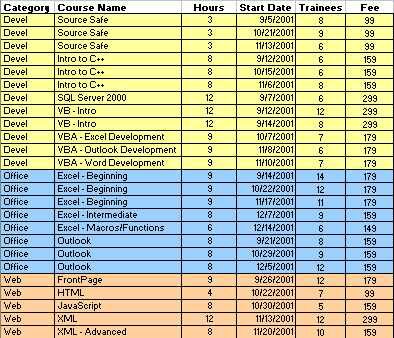
Click here to download the database, or use an Excel database of your own that you're familiar with.
Pivot tables use two types of data:
- Numeric or text fields that can be summarized
- Text fields that label the summarized data
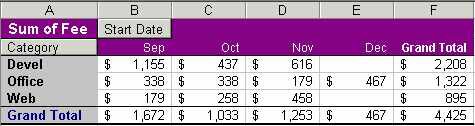
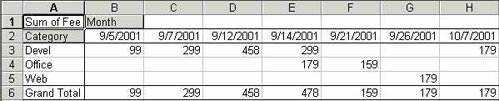
Numeric data fields can be summarized using SUM, AVERAGE, MAX, MIN, and the other aggregate functions including COUNT. (As with the Subtotals feature, text fields can only be summarized with the COUNT function.) For example, we can use the SUM function to create a table summarizing the course fees for each category by month. This pivot table took about 20 seconds to create and format:
Yes, you can use formulas or subtotals to calculate this information: after all, it's only a set of subtotals. But a pivot table has some real advantages over the subtotals function:
- Before you can subtotal, you must sort the database. Pivot tables work on unsorted data, so the original database remains intact.
- Subtotalling inserts rows in your database. A pivot table doesn't change the database.
- Unlike subtotals, pivot tables are dynamic. After you create a pivot table, you can rearrange the columns and rows to look at other aspects of the data.
Creating the Pivot Table
Use the PivotTable and PivotChart Wizard to create your pivot table. Select any cell in the database, and choose Data, PivotTable and PivotChart Report to launch the wizard. (In Excel 97, the menu command is Pivot Table Report.)
Pivot Table Wizard, Step 1:
In the first step of the wizard, specify the type of data you want to work with:
- data in an Excel database
- data from an external source like Microsoft Access
- data that you want to consolidate from several worksheets or sources
- an existing PivotTable
Pivot Table Wizard, Step 2:
In the second step of the wizard, verify the range of the database. If there is no range selected, or if the range is incorrect, select the correct range before clicking the Next button.
Pivot Table Wizard, Step 3:
The third step of the wizard depends on the version of Excel you're using. In Excel 97, you must layout the pivot table by adding fields to the table in the third step. In Excel 2000 (and 2002), layout can be done now or after closing the wizard. To layout the table in the wizard in Excel 2000/2002, click the Layout button in Step 3 of the wizard to open the Layout dialog box, which looks a lot like Step 3 of the Wizard in Excel 97:
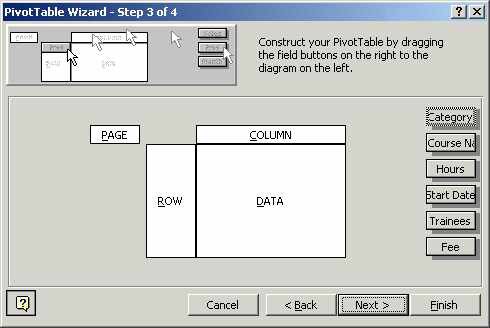
A pivot table contains four areas which are clearly labeled: the Page area, the Column area, the Row area, and the Data area. You create a table by placing fields in each of the areas. Drag the field buttons on the right into one of the four areas of the pivot table.
- The Row and Column Areas -- Place the fields you want to compare in the Row and Column areas. For example, you might want to compare categories and months to determine which categories of courses generated the most revenue each month. To do this, drag the Start Date button to either the Row or Column area, and the Category button to the other area. When you finish the wizard, Excel will examine the fields you've chosen. Each unique entry in the field becomes a row or column heading - an item - in the pivot table. In our pivot table, we placed Start Date in the Column area and Category in the Row area.
- The Page Area -- While you can filter items in the Row area and Column area, the Page area is used specifically to filter the pivot table to create separate reports or separate pivot tables for each value. If you need to create separate reports for values in one or more fields, drag those field buttons to the Page area. In our pivot table, we left the Page area empty.
-
The Data Area -- The field that you want to summarize (SUM, COUNT, etc) goes in the Data area. As you drop the field button into the Data area, Excel indicates the default summary type for the data in the field button. For example, if you drop the Fee button in the Data area, Excel labels the button Sum of Fee. SUM is the default for values; COUNT is the default for columns that contain text entries, dates, or times. If a column contains even one text entry other than the column heading, you can only COUNT the entries.
To change the summarization method, double click the field button in the data area to open the Pivot Table Field dialog box. Choose a summarization method, then click OK.
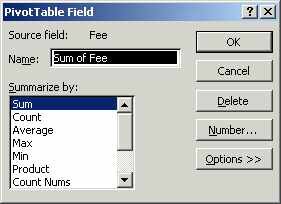
In our pivot table, we placed Fee in the Data area and chose the SUM function. When you finish adding fields to the pivot table layout, click Next (in Excel 97) or close the dialog box (in Excel 2000/2002).
Finishing the Wizard:
In the last step of the wizard specify the destination for the pivot table. The default destination is a new worksheet. To place the pivot table in an existing worksheet, click Existing Worksheet. Identify a cell address for the upper-left corner of the pivot table. Click Finish to create the pivot table.
Modifying the Pivot Table
If you've been following along using our database, you'll have a pivot table with dates and categories in the Row and Column areas, and fees in the Data area. Each date in the Column area is a unique entry:
Grouping Dates
The goal was a summary by month, not by date, so we need to tweak the pivot table a bit more. To rollup dates into weeks, months, quarters or years, you need to group the dates. Right click on the Start Date field button and choose Group and Outline then Group from the menu to open the Grouping dialog box.
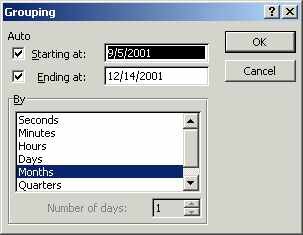
Choose Month from the list of date groups and click OK to group the pivot table dates by month.
Formatting the Table
To format a field, click the field button then use the buttons on the Formatting toolbar or the Format Cells dialog box to format the cells. To apply an AutoFormat choose Format then AutoFormat from the menu. Select a format and click OK to apply it. Excel 2002 includes a dozen formats specifically created for pivot tables, but the palette of AutoFormats in Excel 97 and 2000 has several report formats that work well with pivot tables.
Changing Pivot Table Layout
In every version of Excel, you can edit the pivot table with drag and drop. Drag a button from the table and drop it to remove the field. Drag a new field button into one of the four table areas from the field list (in Excel 2002) or the Pivot Table toolbar (in Excel 2000).
In Excel 97, you can drag fields from one area to another, but to add fields you must return to the wizard. Select any cell in the pivot table, right click and choose Wizard from the shortcut menu to return to the Layout page. Drag field buttons into the four pivot table areas, then click Finish to close the wizard and return to the pivot table.
Moving Beyond the Basics
These are the basics you need for the MOUS Excel Expert exam -- but this is just the beginning. When you're comfortable creating, modifying, and formatting pivot tables, right click on any of the field buttons and check out the shortcut menu commands including Options and Filter. Or double click any non-zero value in the Data area to drill down in the pivot table and expose the underlying data. Or right click in the Data area and choose Insert to insert a calculated field. Create pivot tables with the same field placed twice in the Data area to show the average and sum side by side. Right click the field button for the Data field, then click the Options button to open a new world of analysis including running totals or percentages of the row, column, or grand total. The pivot tables feature has options to burn, and will serve you well whether you need subtotals or an in-depth analysis of your database.
Questions? Commments? Post your thoughts on this column below!
|

 Column Story
